2012 election results demographic: In depth analysis of the demographics of the 2012 Presidential election by State including education, income, and religious views such as same sex marriage.
Update 6/3/2013
Interesting information released by the College Republican National Committee #CRNC today in a 95 page report. http://images.skem1.com/client_id_32089/Grand_Old_Party_for_a_Brand_New_Generation.pdf
Seems like they are starting to recognize the issues with mixing religion and politics. Not sure I like the idea of just spinning their message to hide the underlying problems.
Original Post 11/18/2012
Taking a short break from my normal topics of food and travel, I have been thinking quite a bit lately about the recent election and the polarization surrounding it. Maybe it has always been this way, but to me it seems like this past election was a particularly divided one. Even in my own little microcosm, I have been surprised at how passionate friends from opposing views have become. “Passionate” in italics because it has too positive a connotation – I just can’t come up with a better word. Vehemence maybe?
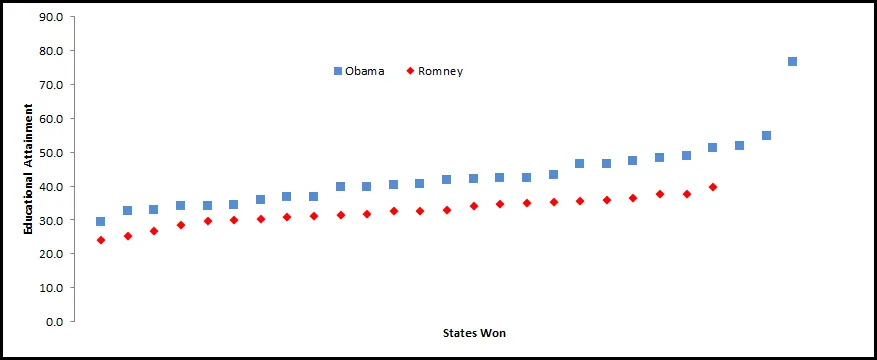
Regardless of semantics, all of the arguing back and forth got me wondering about who really votes for who and my curiosity got the better of me. I did some digging around and found some interesting stats that I pulled together below. Here is a comparative analysis of the states won by each candidate in relation to the educational attainment level as a percent of population by state.
First, it may be helpful to define what is the educational attainment level by state and the process for compiling this data. The Census bureau provides info on the percent of graduates by state population1 – for High School, Bachelor plus, and advanced degree plus. For this analysis, Bachelor plus and advanced plus were added together from the most recent census (2009) to come up with a combined score. Then all States were ranked from top to bottom. After ranking the States by education level attainment, I then input the candidates election results by state2. Graphical analysis and the actual data follow. All graphs were created by me so please give credit where credit is due if you want to share.
| Rank | State | % of Bach+ | % of Adv+ | Combined % | Candidate |
| 1 | District of Columbia | 48.5 | 28.0 | 76.5 | Obama |
| 2 | Massachusetts | 38.2 | 16.4 | 54.6 | Obama |
| 3 | Maryland | 35.7 | 16.0 | 51.7 | Obama |
| 4 | Connecticut | 35.6 | 15.5 | 51.1 | Obama |
| 5 | Colorado | 35.9 | 12.7 | 48.6 | Obama |
| 6 | Virginia | 34.0 | 14.1 | 48.1 | Obama |
| 7 | New Jersey | 34.5 | 12.9 | 47.4 | Obama |
| 8 | Vermont | 33.1 | 13.3 | 46.4 | Obama |
| 9 | New York | 32.4 | 14.0 | 46.4 | Obama |
| 10 | New Hampshire | 32.0 | 11.2 | 43.2 | Obama |
| 11 | Illinois | 30.6 | 11.7 | 42.3 | Obama |
| 12 | Rhode Island | 30.5 | 11.7 | 42.2 | Obama |
| 13 | Washington | 31.0 | 11.1 | 42.1 | Obama |
| 14 | Minnesota | 31.5 | 10.3 | 41.8 | Obama |
| 15 | California | 29.9 | 10.7 | 40.6 | Obama |
| 16 | Delaware | 28.7 | 11.4 | 40.1 | Obama |
| 17 | Kansas | 29.5 | 10.2 | 39.7 | Romney |
| 18 | Oregon | 29.2 | 10.4 | 39.6 | Obama |
| 19 | Hawaii | 29.6 | 9.9 | 39.5 | Obama |
| 20 | Utah | 28.5 | 9.1 | 37.6 | Romney |
| 21 | Georgia | 27.5 | 9.9 | 37.4 | Romney |
| 22 | Pennsylvania | 26.4 | 10.2 | 36.6 | Obama |
| 23 | Maine | 26.9 | 9.6 | 36.5 | Obama |
| 24 | Nebraska | 27.4 | 8.8 | 36.2 | Romney |
| 25 | Montana | 27.4 | 8.3 | 35.7 | Romney |
| 26 | New Mexico | 25.3 | 10.4 | 35.7 | Obama |
| 27 | Alaska | 26.6 | 9.0 | 35.6 | Romney |
| 28 | North Carolina | 26.5 | 8.8 | 35.3 | Romney |
| 29 | Arizona | 25.6 | 9.3 | 34.9 | Romney |
| 30 | Missouri | 25.2 | 9.5 | 34.7 | Romney |
| 31 | Florida | 25.3 | 9.0 | 34.3 | Obama |
| 32 | Wisconsin | 25.7 | 8.4 | 34.1 | Obama |
| 33 | Michigan | 24.6 | 9.4 | 34.0 | Obama |
| 34 | Texas | 25.5 | 8.5 | 34.0 | Romney |
| 35 | Ohio | 24.1 | 8.8 | 32.9 | Obama |
| 36 | South Carolina | 24.3 | 8.4 | 32.7 | Romney |
| 37 | Iowa | 25.1 | 7.4 | 32.5 | Obama |
| 38 | North Dakota | 25.8 | 6.7 | 32.5 | Romney |
| 39 | South Dakota | 25.1 | 7.3 | 32.4 | Romney |
| 40 | Wyoming | 23.8 | 7.9 | 31.7 | Romney |
| 41 | Idaho | 23.9 | 7.5 | 31.4 | Romney |
| 42 | Tennessee | 23.0 | 7.9 | 30.9 | Romney |
| 43 | Indiana | 22.5 | 8.1 | 30.6 | Romney |
| 44 | Oklahoma | 22.7 | 7.4 | 30.1 | Romney |
| 45 | Alabama | 22.0 | 7.7 | 29.7 | Romney |
| 46 | Kentucky | 21.0 | 8.5 | 29.5 | Romney |
| 47 | Nevada | 21.8 | 7.6 | 29.4 | Obama |
| 48 | Louisiana | 21.4 | 6.9 | 28.3 | Romney |
| 49 | Mississippi | 19.6 | 7.1 | 26.7 | Romney |
| 50 | Arkansas | 18.9 | 6.1 | 25.0 | Romney |
| 51 | West Virginia | 17.3 | 6.7 | 24.0 | Romney |
The results are interesting to say the least. It is pretty clear that there is a correlation between the States Obama won and the education level of voters by state. I want to know why.
Why did the sixteen most educated States (including DC) all vote for Obama? On the flip side, Romney took fourteen of the sixteen least educated States. It would be typical to just focus on the top/bottom 10, but it really drives the point home to take it all the way to 16, since it is not until #17 that Romney shows up.
It would be fun to stop here and say Republicans just aren’t as smart, but I know that is not true and I am really curious if there are other correlations. To further analyze the data, I researched info on voter demographics related to education levels compared to what are considered Republican vs. Democrat hot button issues. Specifically, in regards to what may be the most contentious – religious views and how they pertain to law.
Even though the Romney campaign did not put many of the previous years religious platforms at the forefront of this election, I couldn’t help but notice all the chatter leading up to the election- the heated exchanges around Christian values, pro-life candidates (up to including rape now), gay marriage and contraception – with these last two being highlighted by the end of summer Chic-Filet story3 and Obamacare backlash from Christian backed corporations4. These topics were all over Facebook, Twitter, and just about any online article I read, whether political or not – and all were subject to left vs right passionate, often offensive, commentary.
In researching a few surveys though, I found that recent statistics point to a population that is less and less religious5. Further, there is a growing population that supports gay marriage and is pro-choice6. In comparing this data to education level, it turns out, those with a higher education are more likely to support gay marriage and be pro-choice7. And the trend in education is that more and more people are attaining higher degrees8.
Put bluntly, it appears there is a larger population that is attaining higher education and this population leans towards science and tolerance as opposed to making Bible based decisions.
The other part of this that perplexes me is the income question. I was under the impression that the rich voted Republican, but what doesn’t make sense is that higher education is directly correlated to higher income. When I take two points of data into account though, I am questioning whether the rich really do vote republican or if it is mainly just the uber rich?
Data point one – look at any map of the election results. Middle America and the South were pretty much all Republican. I have traveled throughout the South and I would hardly say there is an abundance of wealth there. On the contrary, areas of great innovation and employment such as CA/DC/MA/NY – they voted predominantly Democrat.
Data point two – my own personal network. While it is not the most scientific method, it is a glimpse at what is going on at a greater scale. For the most part, my Republican friends have one thing in common – they all hold religion in high regard. The more religious, the more passionate they are about things like same sex marriage and abortion.
As for my Democrat friends, most would probably describe themselves as spiritual at most. And oddly enough, within my own circle, on average – the higher the education and the greater their income means the more likely they vote Democrat.
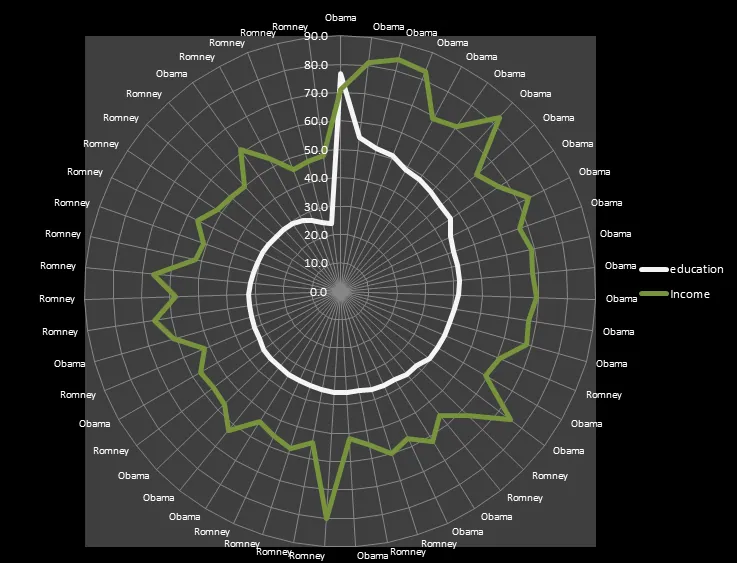
Just to confirm my sanity, I ran the median income numbers from the most recent census against the above census/election data and it confirms higher education does correlate to higher income. Average median income for the top 16 most educated States is $71,125 and the bottom sixteen states come in at $54,375. That is about a 30% delta. Chart and data follow.
| State | Winner | Education | Median Income |
| District of Columbia | Obama | 76.5 | 71 |
| Massachusetts | Obama | 54.6 | 81 |
| Maryland | Obama | 51.7 | 84 |
| Connecticut | Obama | 51.1 | 83 |
| Colorado | Obama | 48.6 | 69 |
| Virginia | Obama | 48.1 | 71 |
| New Jersey | Obama | 47.4 | 83 |
| Vermont | Obama | 46.4 | 63 |
| New York | Obama | 46.4 | 67 |
| New Hampshire | Obama | 43.2 | 74 |
| Illinois | Obama | 42.3 | 67 |
| Rhode Island | Obama | 42.2 | 69 |
| Washington | Obama | 42.1 | 68 |
| Minnesota | Obama | 41.8 | 69 |
| California | Obama | 40.6 | 67 |
| Delaware | Obama | 40.1 | 68 |
| Kansas | Romney | 39.7 | 61 |
| Oregon | Obama | 39.6 | 59 |
| Hawaii | Obama | 39.5 | 75 |
| Utah | Romney | 37.6 | 63 |
| Georgia | Romney | 37.4 | 56 |
| Pennsylvania | Obama | 36.6 | 62 |
| Maine | Obama | 36.5 | 57 |
| Nebraska | Romney | 36.2 | 60 |
| Montana | Romney | 35.7 | 55 |
| New Mexico | Obama | 35.7 | 52 |
| Alaska | Romney | 35.6 | 80 |
| North Carolina | Romney | 35.3 | 54 |
| Arizona | Romney | 34.9 | 58 |
| Missouri | Romney | 34.7 | 56 |
| Florida | Obama | 34.3 | 54 |
| Wisconsin | Obama | 34.1 | 63 |
| Michigan | Obama | 34.0 | 57 |
| Texas | Romney | 34.0 | 56 |
| Ohio | Obama | 32.9 | 57 |
| South Carolina | Romney | 32.7 | 52 |
| Iowa | Obama | 32.5 | 61 |
| North Dakota | Romney | 32.5 | 66 |
| South Dakota | Romney | 32.4 | 58 |
| Wyoming | Romney | 31.7 | 66 |
| Idaho | Romney | 31.4 | 52 |
| Tennessee | Romney | 30.9 | 51 |
| Indiana | Romney | 30.6 | 56 |
| Oklahoma | Romney | 30.1 | 52 |
| Alabama | Romney | 29.7 | 51 |
| Kentucky | Romney | 29.5 | 50 |
| Nevada | Obama | 29.4 | 61 |
| Louisiana | Romney | 28.3 | 53 |
| Mississippi | Romney | 26.7 | 46 |
| Arkansas | Romney | 25.0 | 47 |
| West Virginia | Romney | 24.0 | 48 |
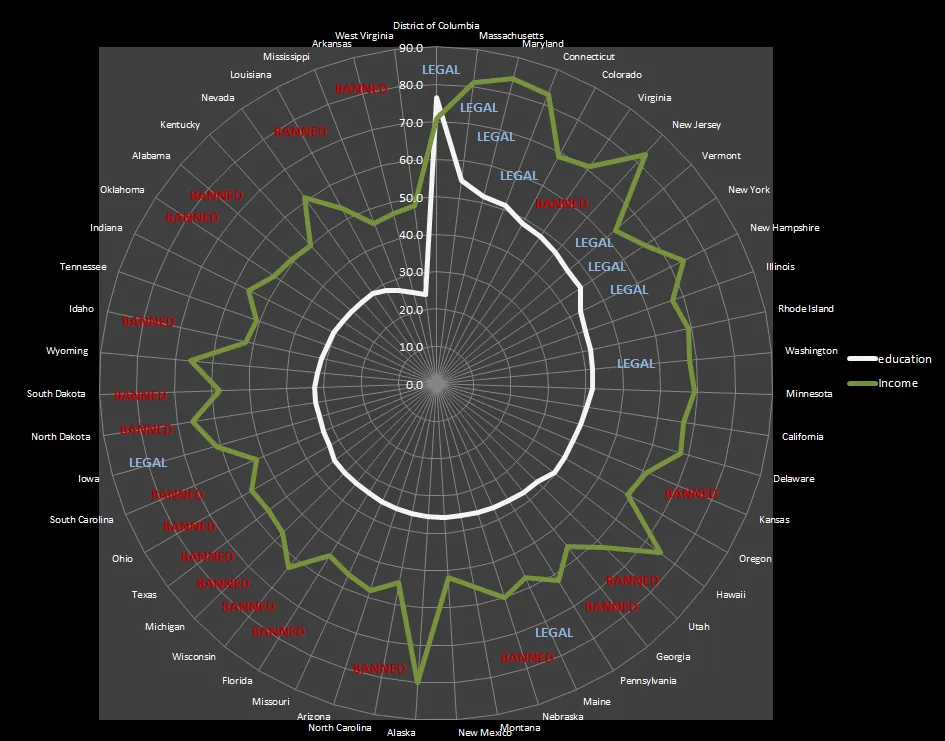
Taking the above chart and inputting each states official current law on same sex marriage further illustrates the point. Just to keep things simple, I only highlighted those that have legalized same sex marriage and those that have banned both same sex marriages and unions9. All other States generally follow their “sides” in either allowing civil unions (but not yet legalized marriage) or are in the process of trying to ban marriage/union.
I would love to be able to keep researching the different correlations, but I do have a day job and more important things to do like make interesting food. My next search would have been on race statistics, but I am willing to bet that there is a visible difference in ethnic diversity that follows the education and income trend.
So what does all this data mean? I would venture to guess that depends on who you ask, but for me, it just raises more questions. Questions about tolerance and demographics. Questions about the Constitution, conspiracy theories, propaganda, and even economics. Questions of science, science and progress…. I kid with the Coldplay reference, but it makes me question the ability of the country to progress when it is so divided.
The one final question I do have is – if Republicans need to win these states with a higher percentage of educated voters in order to win the presidency, what should they do to improve their performance in upcoming elections? Their choices seem to be fairly limited – either put up a more moderate candidate or figure out a way to stymie education so they can grow their base of uneducated voters.
2012 Presidential Election Demographic Analysis
Update 6/3/2013
Interesting information released by the College Republican National Committee #CRNC today in a 95 page report. http://images.skem1.com/client_id_32089/Grand_Old_Party_for_a_Brand_New_Generation.pdf
Seems like they are starting to recognize the issues with mixing religion with politics.
SOURCES:
1) http://www.census.gov/compendia/statab/2012/tables/12s0233.pdf
2) http://www.politico.com/2012-election/map/#/President/2012/
4) http://www.cbn.com/cbnnews/us/2012/October/Large-Denver-Company-Fights-Obamacare-Demands/
6) http://pewresearch.org/pubs/1994/poll-support-for-acceptance-of-homosexuality-gay-parenting-marriage
7) http://pewresearch.org/pubs/1994/poll-support-for-acceptance-of-homosexuality-gay-parenting-marriage
http://www.gallup.com/poll/154946/Non-Christians-Postgrads-Highly-Pro-Choice.aspx
http://www.pollingreport.com/abortion.htm
9) http://en.wikipedia.org/wiki/Same-sex_marriage_status_in_the_United_States_by_state